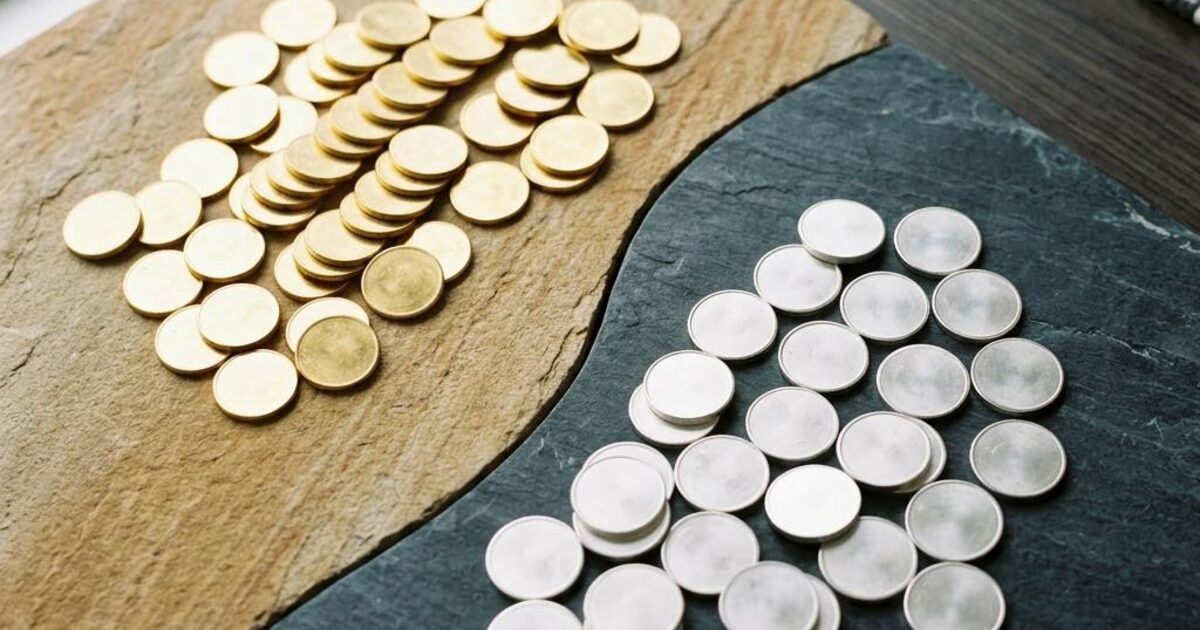
The gold–silver ratio is often used to make confident claims that one metal must soon catch up with the other. The calculation itself is straightforward, but the prediction is not. A ratio tells us the relationship between two quoted prices at a particular time. It does not establish an equilibrium that the market is required to restore.
The October 23 calculation
Reuters' October 23 report quoted spot gold at $4,026.15 per troy ounce at 09:36 GMT and listed spot silver at $53.8882 per troy ounce in the same market report. Dividing the quoted gold figure by the quoted silver figure gives approximately 74.7. In plain language, one ounce of gold had the same quoted metal value as roughly 74.7 ounces of silver using those reported figures.
This is an approximate comparison of published prices, not a claim that the two observations are perfectly synchronized executable trades. Data feeds, spreads, and observation times can differ. The result is a dated reference, not a live ratio display or a promise that anyone will exchange physical metal on those exact terms.
More than one price path can change the ratio
- The ratio can fall if silver rises faster than gold.
- It can also fall if gold declines while silver holds steady.
- The ratio can rise even while both metals rise, if gold rises faster.
- It can remain similar while both metals fall substantially.
That last possibility is important for an owner who cares about dollar proceeds rather than relative performance. A stable ratio does not guarantee stable values. A prediction about the ratio is also incomplete unless it explains the separate assumptions for gold and silver, the time horizon, and the risks that could change either side.
Physical items add another layer
The ratio compares quoted pure-metal values per troy ounce. It does not compare a 14K ring with an equal-weight sterling spoon, and it does not assign collector value to coins. Gold purity, silver fineness, stones, construction, and product premiums all affect an item-specific assessment. Plated material is different again and should not be modeled as solid precious metal.
Use it to ask better questions
The ratio can help you notice that two metals are responding differently to market conditions. It should prompt investigation rather than substitute for it. For a mixed collection, identify and weigh the gold and silver groups separately, preserve potentially collectible pieces, and ask for a clear calculation for each. That produces more actionable information than a claim that one metal is automatically due for a rally.
Editorial note — researched October 23, 2026. Dated market figures are snapshots, not a live feed or a purchase offer. Forward-looking scenarios are analysis, not guarantees or personalized investment advice. Check a fresh quote before making a decision.
Have both gold and silver to sell? Gold Buyers Connecticut can assess each group separately, using the right purity, weight, and product identification rather than a ratio shortcut.